How Zerops scales Java
Zerops automatically scales your Java service based on actual usage. When your application needs more power, resources increase. When demand drops, resources scale down to reduce costs.
For complete scaling details across all services, see Automatic Scaling and High Availability.
How it works
Vertical scaling adds more CPU, RAM, or disk space to existing containers. This approach is applied first because it is faster and more efficient.
Horizontal scaling creates entirely new containers when vertical scaling reaches its configured limits.
Learn more about vertical and horizontal scaling and complete technical details in our scaling guide.
Configure scaling
You can configure scaling settings at different stages:
-
During service creation - Set initial scaling parameters when creating your Java service in the Zerops GUI.
-
During import - Define scaling configuration in your YAML import file using the
verticalAutoscalingand horizontal scaling parameters. See Import & Export YAML Configuration for complete syntax. -
After service creation - Navigate to your Java service and select Automatic scaling configuration from the menu to modify settings.
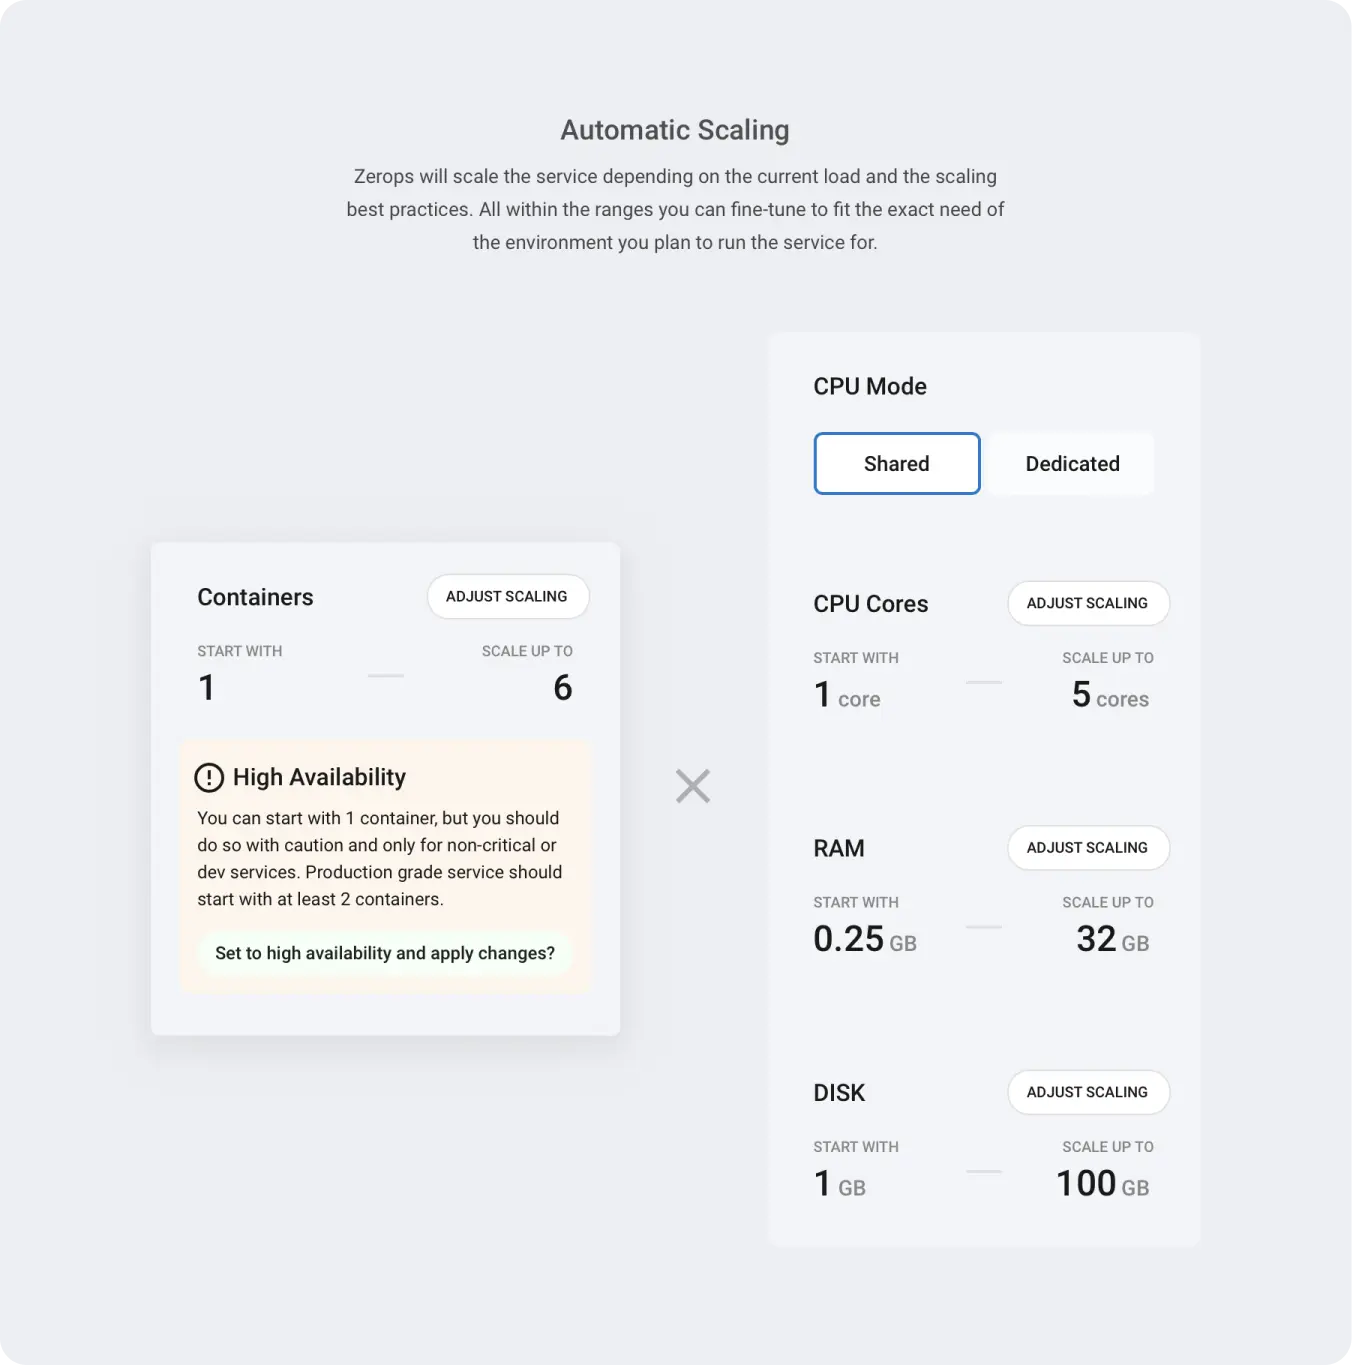
CPU Settings
CPU mode: Choose between shared (cost-effective, variable performance) or dedicated (consistent performance, higher cost). You can change CPU mode once per hour. See pricing for costs or read more about CPU mode.
Minimum and Maximum CPU: Configure the boundaries for CPU core allocation. Zerops will scale CPU resources within these limits based on actual usage.
| Minimum CPU cores | 1 |
| Maximum CPU cores | 8 |
Set minimum = maximum to disable automatic CPU scaling.
Start CPU cores: Determines how many CPU cores are allocated during application startup. Increase this value if your Java application starts slowly or requires more processing power during initialization.
- Default: 2 cores
CPU Scaling Thresholds (for dedicated CPU mode only):
- Min free CPU %: Triggers scaling when free CPU drops below this percentage of a single core
- Dynamic free total %: Triggers scaling when total free CPU across all cores drops below this percentage
More details on CPU Settings.
RAM Settings
Minimum and Maximum RAM: Configure the boundaries for RAM allocation. Zerops will scale RAM within these limits based on actual usage.
| Minimum RAM | 0.125 GB |
| Maximum RAM | 48 GB |
Set minimum = maximum to disable automatic RAM scaling.
RAM Scaling Thresholds: Help prevent out-of-memory crashes by maintaining buffer space:
- Absolute (GB): Maintains this amount of free RAM at all times
- Percentage: Keeps this percentage of total RAM free
Consider increasing these values if your application experiences memory-related crashes.
More details on RAM Settings.
Disk Settings
Minimum and Maximum Disk: Configure the boundaries for disk space allocation. Zerops will scale disk space within these limits based on actual usage.
| Minimum disk | 1 GB |
| Maximum disk | 250 GB |
Set minimum = maximum to disable automatic disk scaling.
More details on Disk Settings.
Container Settings
Container limits: Set how many containers your Java service can scale to:
| Minimum containers | 1 |
| Maximum containers | 10 |
Single container (maximum = 1): More cost-effective, but your application will experience downtime if the container fails. This mode is suitable for development and testing environments.
Multiple containers (maximum > 1): Can provide high availability for production environments, but only if your Java application is properly designed for it. Each container runs on a different physical server for redundancy. Your application must be stateless and avoid storing data in local files to work properly across multiple containers.
More details on Horizontal Scaling.
Monitor usage
Navigate to your service and select Service dashboard & runtime containers to view:
- CPU, RAM, and disk usage over time
- Number of active containers
- Historical scaling events
Learn about monitoring your infrastructure in detail.
Common issues
Out of memory crashes
- Increase the minimum free RAM settings in your scaling configuration
- Review your code for potential memory leaks
Higher than expected costs
- Consider lowering your maximum resource limits
Application issues with multiple containers
- Remove dependencies on local file storage (use external storage services instead)
- Implement session management that works across containers (consider using Redis or external session stores)
- Ensure your application is designed to be stateless
Slow application startup
- Increase the "Start CPU cores" setting in your scaling configuration
- Consider switching to dedicated CPU mode for more consistent performance
More troubleshooting tips: Scaling Troubleshooting.
Have questions? Join our Discord community for help!